Energy
Mapped: The World’s Nuclear Reactor Landscape
View a more detailed version of this map


The World’s Changing Nuclear Reactor Landscape
View a more detailed version of the above map by clicking here
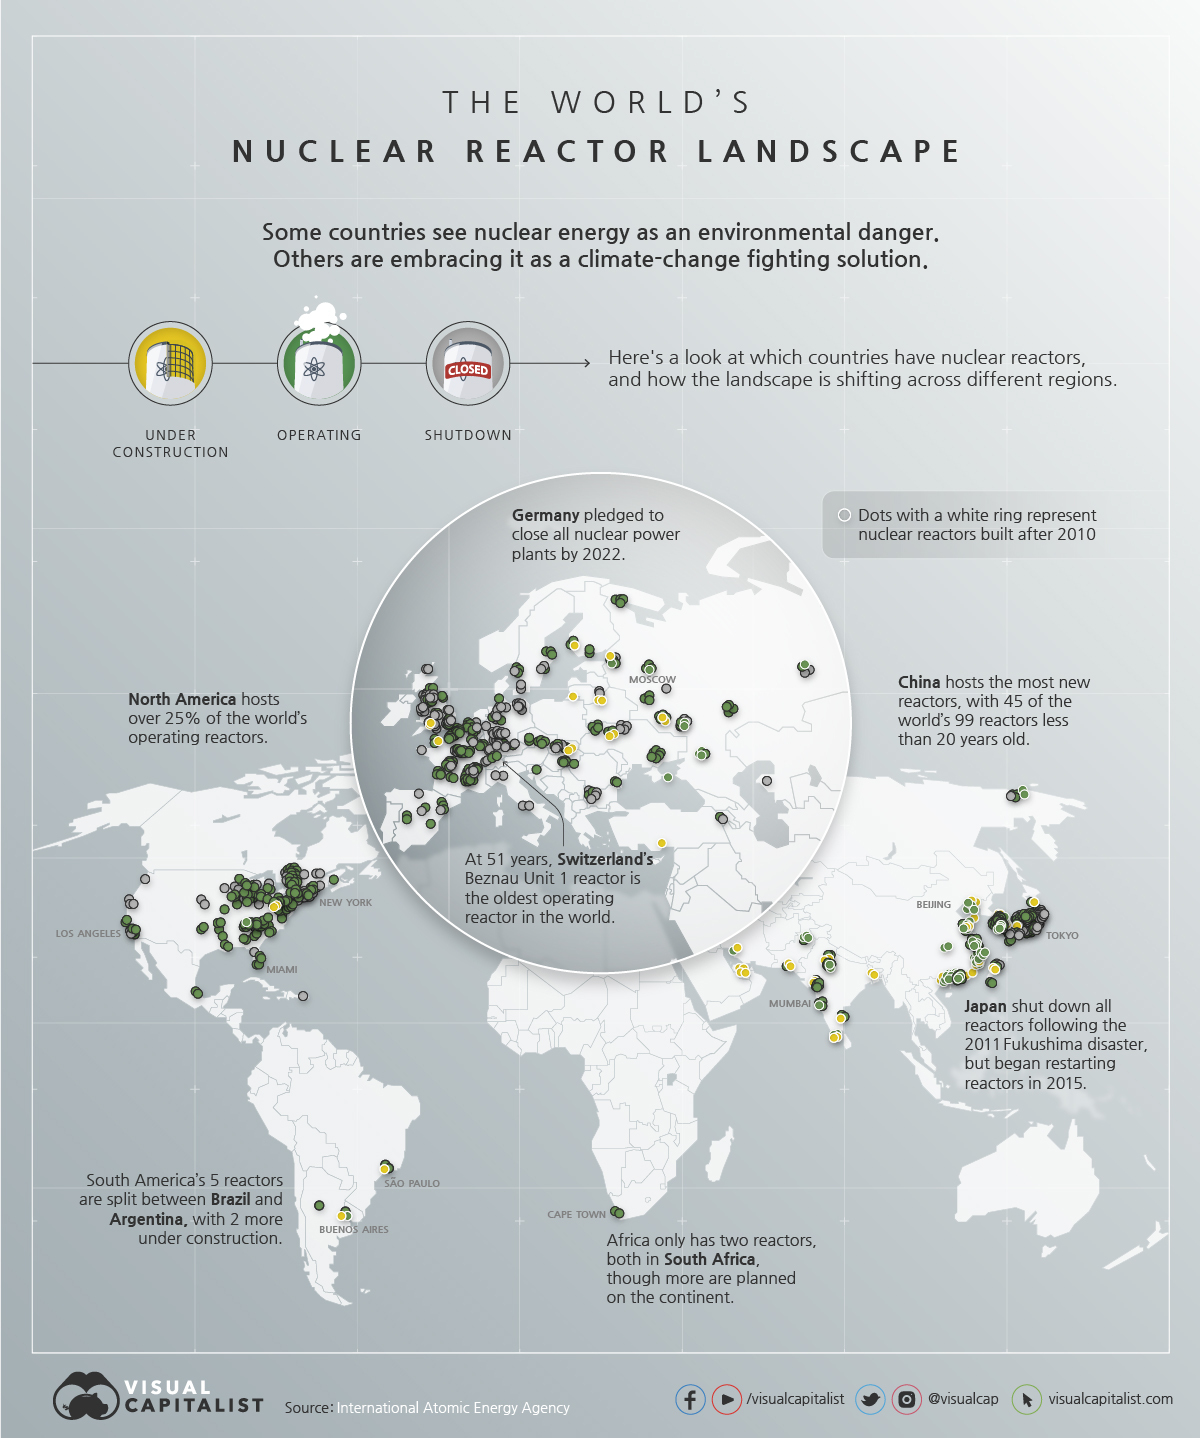
Following the 2011 Fukushima nuclear disaster in Japan, the most severe nuclear accident since Chernobyl, many nations reiterated their intent to wean off the energy source.
However, this sentiment is anything but universal—in many other regions of the world, nuclear power is still ramping up, and it’s expected to be a key energy source for decades to come.
Using data from the Power Reactor Information System, maintained by the International Atomic Energy Agency, the map above gives a comprehensive look at where nuclear reactors are subsiding, and where future capacity will reside.
Increasing Global Nuclear Use
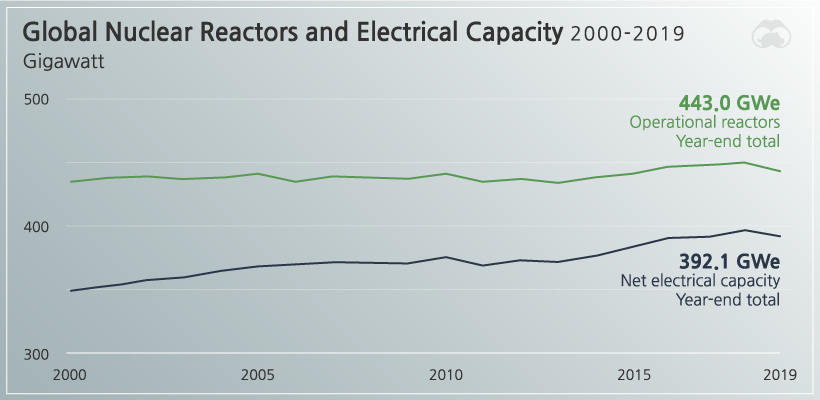
Despite a dip in total capacity and active reactors last year, nuclear power still generated around 10% of the world’s electricity in 2019.
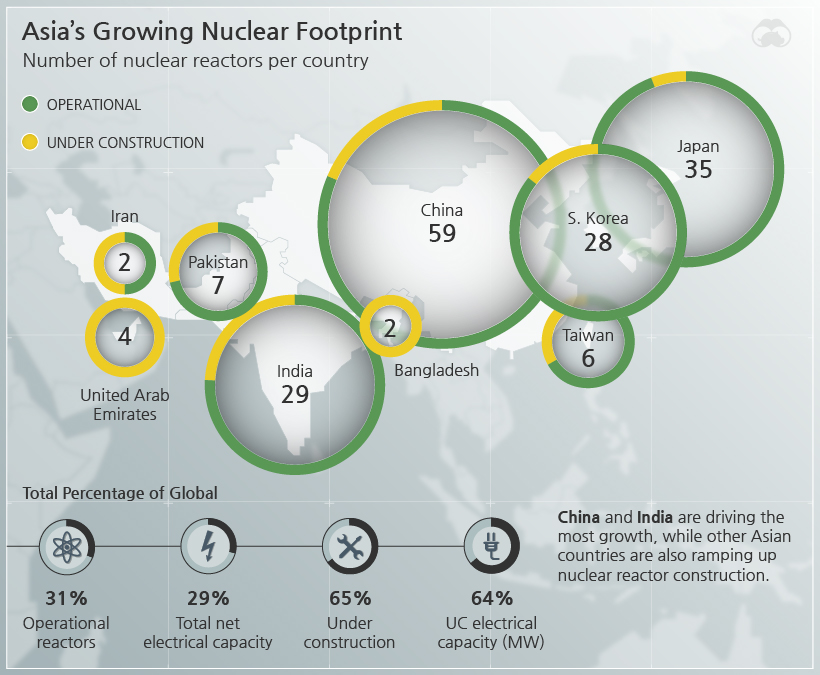
Part of the increased capacity came as Japan restarted some plants and European countries looked to replace aging reactors. But most of the growth is driven by new reactors coming online in Asia and the Middle East.
China is soon to have more than 50 nuclear reactors, while India is set to become a top-ten producer once construction on new reactors is complete.
Decreasing Use in Western Europe and North America
The slight downtrend from 450 operating reactors in 2018 to 443 in 2019 was the result of continued shutdowns in Europe and North America. Home to the majority of the world’s reactors, the two continents also have the oldest reactors, with many being retired.
At the same time, European countries are leading the charge in reducing dependency on the energy source. Germany has pledged to close all nuclear plants by 2022, and Italy has already become the first country to completely shut down their plants.
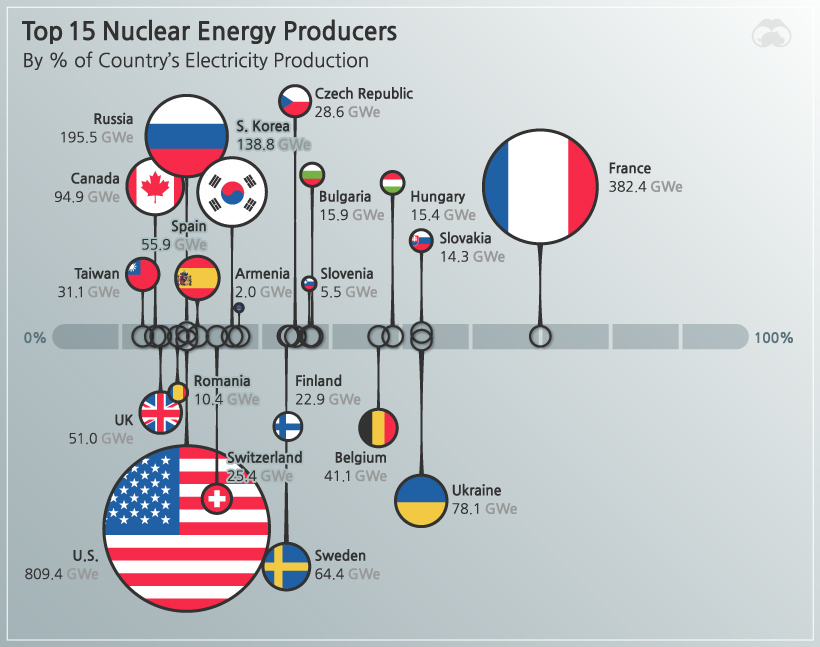
Despite leading in shutdowns, Europe still emerges as the most nuclear-reliant region for a majority of electricity production and consumption.
In addition, some countries are starting to reassess nuclear energy as a means of fighting climate change. Reactors don’t produce greenhouse gases during operation, and are more efficient (and safer) than wind and solar per unit of electricity.
Facing steep emission reduction requirements, a variety of countries are looking to expand nuclear capacity or to begin planning for their first reactors.
A New Generation of Nuclear Reactors?
For those parties interested in the benefits of nuclear power, past accidents have also led towards a push for innovation in the field. That includes studies of miniature nuclear reactors that are easier to manage, as well as full-size reactors with robust redundancy measures that won’t physically melt down.
Additionally, some reactors are being designed with the intention of utilizing accumulated nuclear waste—a byproduct of nuclear energy and weapon production that often had to be stored indefinitely—as a fuel source.
With some regions aiming to reduce reliance on nuclear power, and others starting to embrace it, the landscape is certain to change.


Energy
The World’s Biggest Nuclear Energy Producers
China has grown its nuclear capacity over the last decade, now ranking second on the list of top nuclear energy producers.


The World’s Biggest Nuclear Energy Producers
This was originally posted on our Voronoi app. Download the app for free on Apple or Android and discover incredible data-driven charts from a variety of trusted sources.
Scientists in South Korea recently broke a record in a nuclear fusion experiment. For 48 seconds, they sustained a temperature seven times that of the sun’s core.
But generating commercially viable energy from nuclear fusion still remains more science fiction than reality. Meanwhile, its more reliable sibling, nuclear fission, has been powering our world for many decades.
In this graphic, we visualized the top producers of nuclear energy by their share of the global total, measured in terawatt hours (TWh). Data for this was sourced from the Nuclear Energy Institute, last updated in August 2022.
Which Country Generates the Most Nuclear Energy?
Nuclear energy production in the U.S. is more than twice the amount produced by China (ranked second) and France (ranked third) put together. In total, the U.S. accounts for nearly 30% of global nuclear energy output.
However, nuclear power only accounts for one-fifth of America’s electricity supply. This is in contrast to France, which generates 60% of its electricity from nuclear plants.
| Rank | Country | Nuclear Energy Produced (TWh) | % of Total |
|---|---|---|---|
| 1 | 🇺🇸 U.S. | 772 | 29% |
| 2 | 🇨🇳 China | 383 | 14% |
| 3 | 🇫🇷 France | 363 | 14% |
| 4 | 🇷🇺 Russia | 208 | 8% |
| 5 | 🇰🇷 South Korea | 150 | 6% |
| 6 | 🇨🇦 Canada | 87 | 3% |
| 7 | 🇺🇦 Ukraine | 81 | 3% |
| 8 | 🇩🇪 Germany | 65 | 2% |
| 9 | 🇯🇵 Japan | 61 | 2% |
| 10 | 🇪🇸 Spain | 54 | 2% |
| 11 | 🇸🇪 Sweden | 51 | 2% |
| 12 | 🇧🇪 Belgium | 48 | 2% |
| 13 | 🇬🇧 UK | 42 | 2% |
| 14 | 🇮🇳 India | 40 | 2% |
| 15 | 🇨🇿 Czech Republic | 29 | 1% |
| N/A | 🌐 Other | 219 | 8% |
| N/A | 🌍 Total | 2,653 | 100% |
Another highlight is how China has rapidly grown its nuclear energy capabilities in the last decade. Between 2016 and 2021, for example, it increased its share of global nuclear energy output from less than 10% to more than 14%, overtaking France for second place.
On the opposite end, the UK’s share has slipped to 2% over the same time period.
Meanwhile, Ukraine has heavily relied on nuclear energy to power its grid. In March 2022, it lost access to its key Zaporizhzhia Nuclear Power Station after Russian forces wrested control of the facility. With six 1,000 MW reactors, the plant is one of the largest in Europe. It is currently not producing any power, and has been the site of recent drone attacks.

-

 Mining2 weeks ago
Charted: The Value Gap Between the Gold Price and Gold Miners
-

 Real Estate1 week ago
Ranked: The Most Valuable Housing Markets in America
-

 Business1 week ago
Charted: Big Four Market Share by S&P 500 Audits
-

 AI1 week ago
The Stock Performance of U.S. Chipmakers So Far in 2024
-

 Misc1 week ago
Almost Every EV Stock is Down After Q1 2024
-

 Money2 weeks ago
Where Does One U.S. Tax Dollar Go?
-

 Green2 weeks ago
Ranked: Top Countries by Total Forest Loss Since 2001
-

 Real Estate2 weeks ago
Visualizing America’s Shortage of Affordable Homes